A question on so many minds is “How many Americans are killed by police?”
The website killedbypolice.net is doing a good job at tracking data as far back as two years ago.
While you can find details of each death on the site, I compiled the monthly numbers into an easy-to-read bar graph.
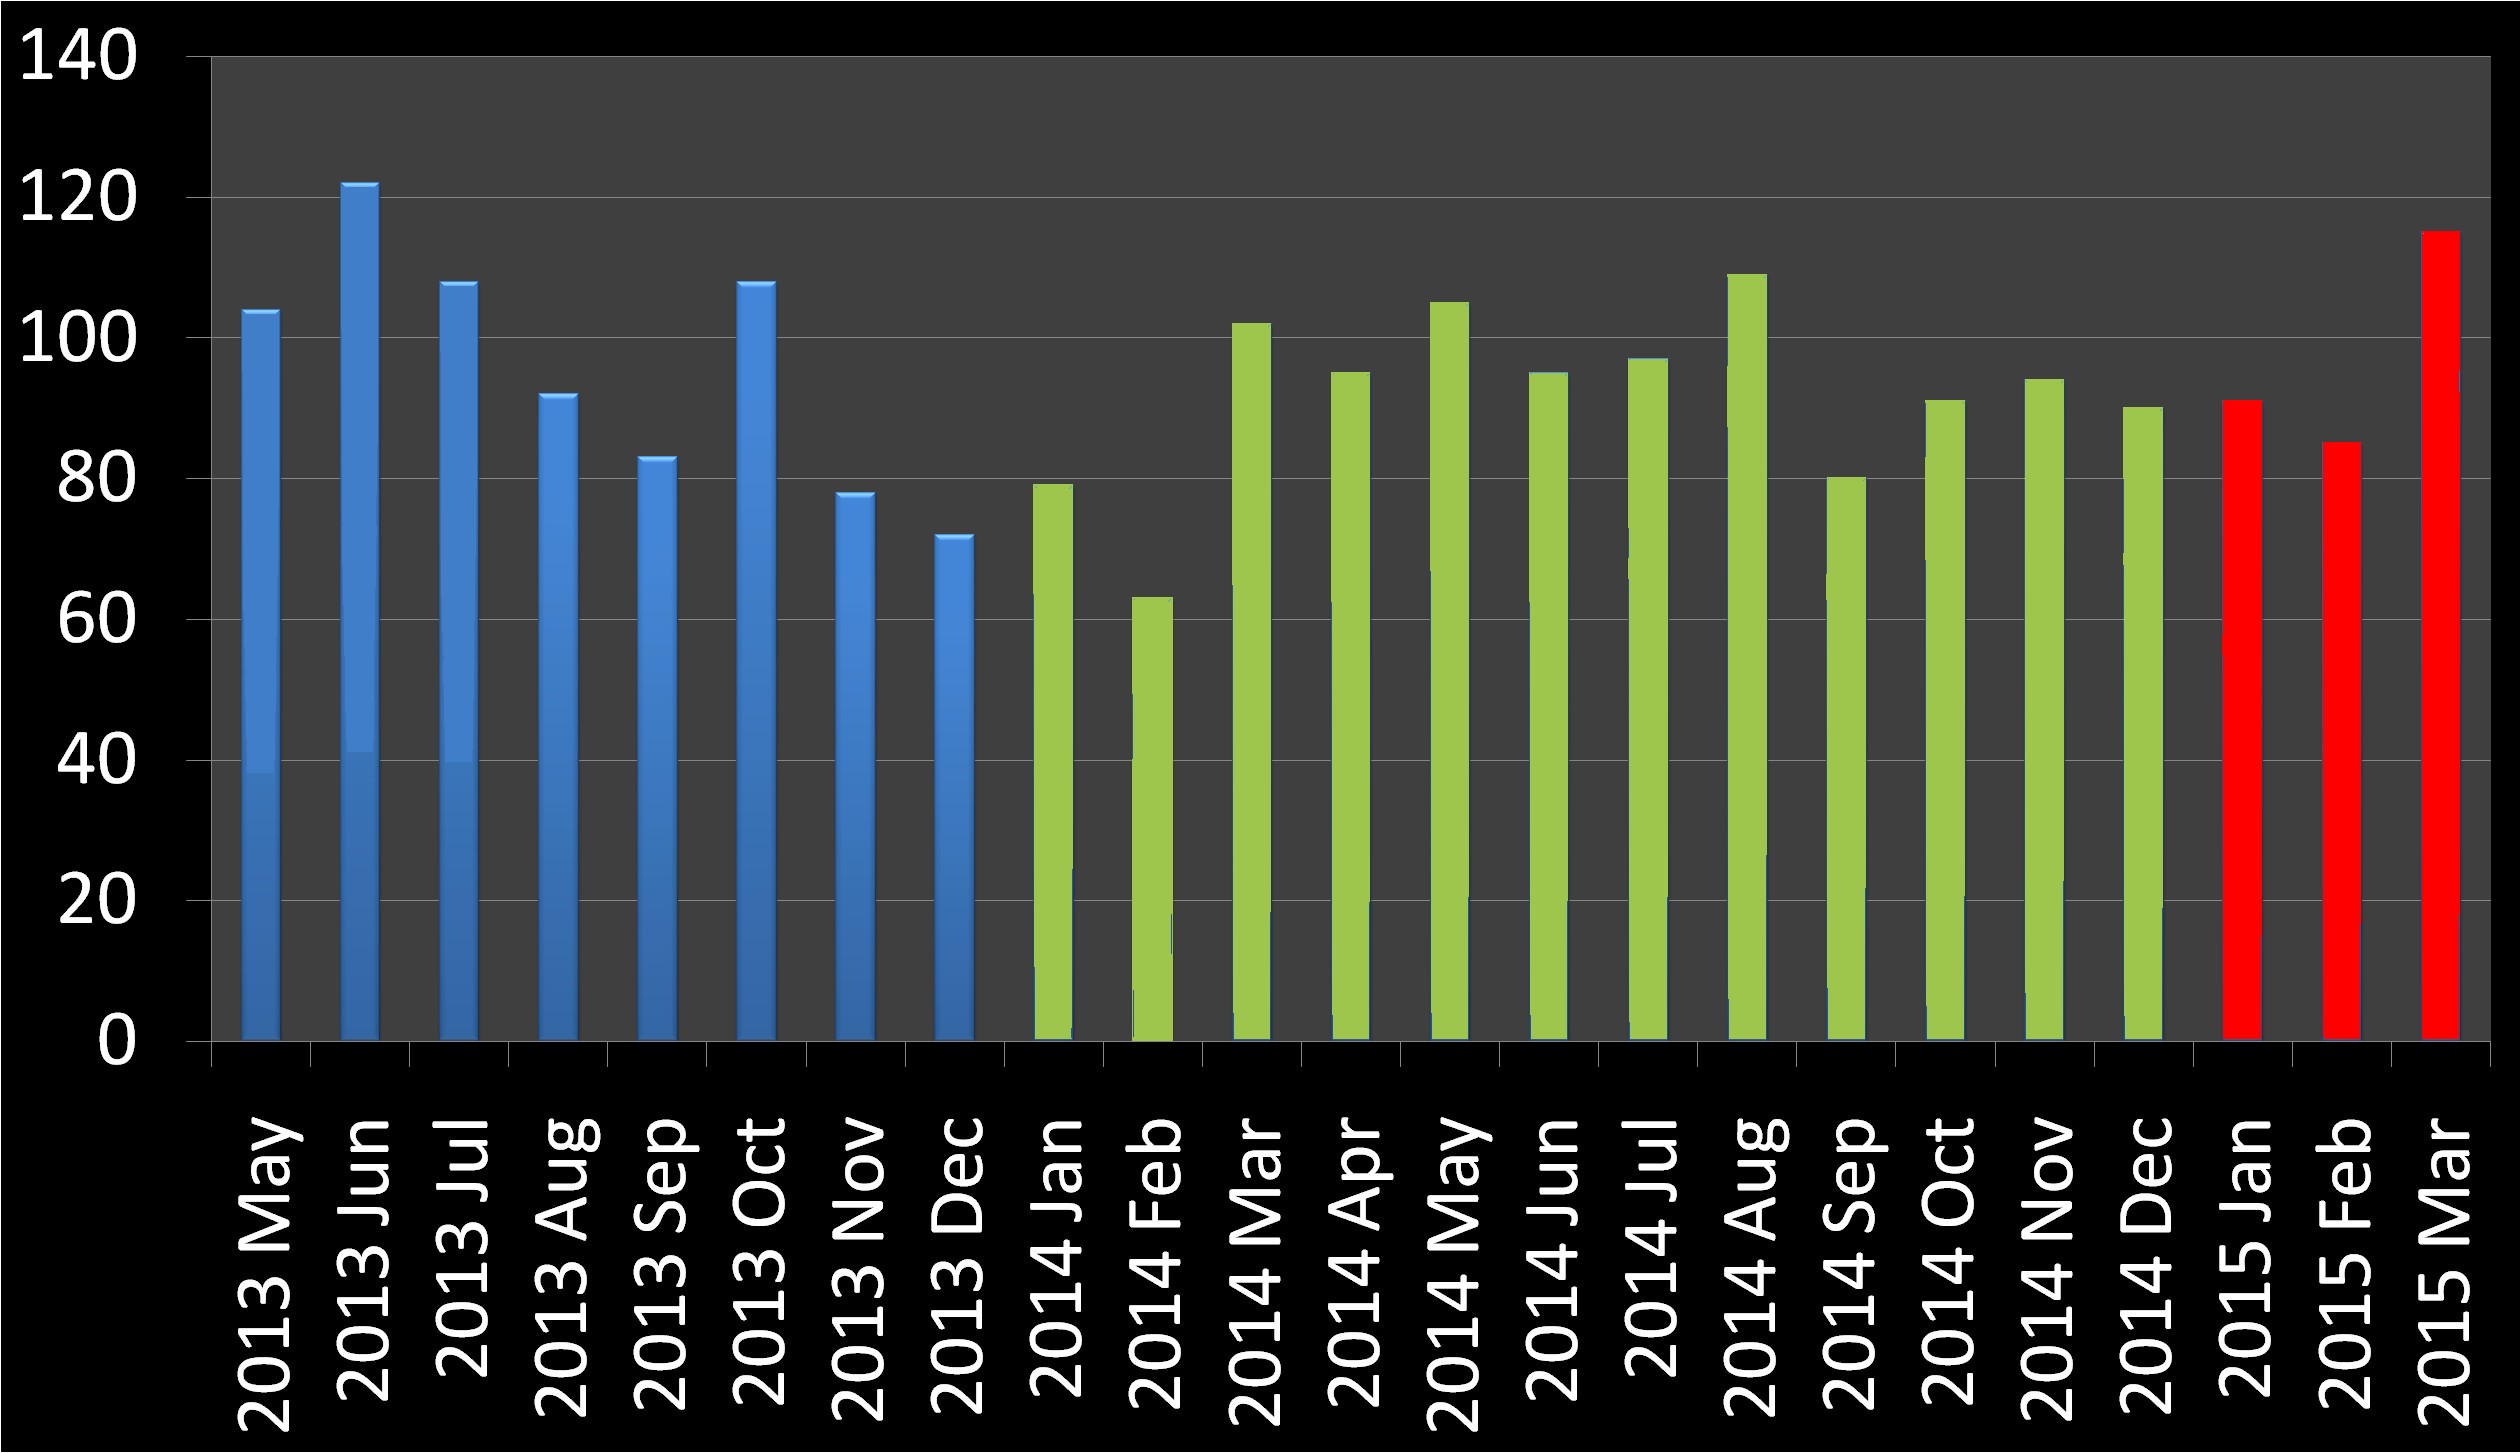
| 2013 May | 104 deaths |
| 2013 June | 122 deaths |
| 2013 July | 108 deaths |
| 2013 August | 92 deaths |
| 2013 September | 83 deaths |
| 2013 October | 108 deaths |
| 2013 November | 78 deaths |
| 2013 December | 72 deaths |
| 2014 January | 79 deaths |
| 2014 February | 63 deaths |
| 2014 March | 102 deaths |
| 2014 April | 95 deaths |
| 2014 May | 105 deaths |
| 2014 June | 95 deaths |
| 2014 July | 97 deaths |
| 2014 August | 109 deaths |
| 2014 September | 80 deaths |
| 2014 October | 91 deaths |
| 2014 November | 94 deaths |
| 2014 December | 90 deaths |
| 2015 January | 91 deaths |
| 2015 February | 85 deaths |
| 2015 March | 115 deaths |
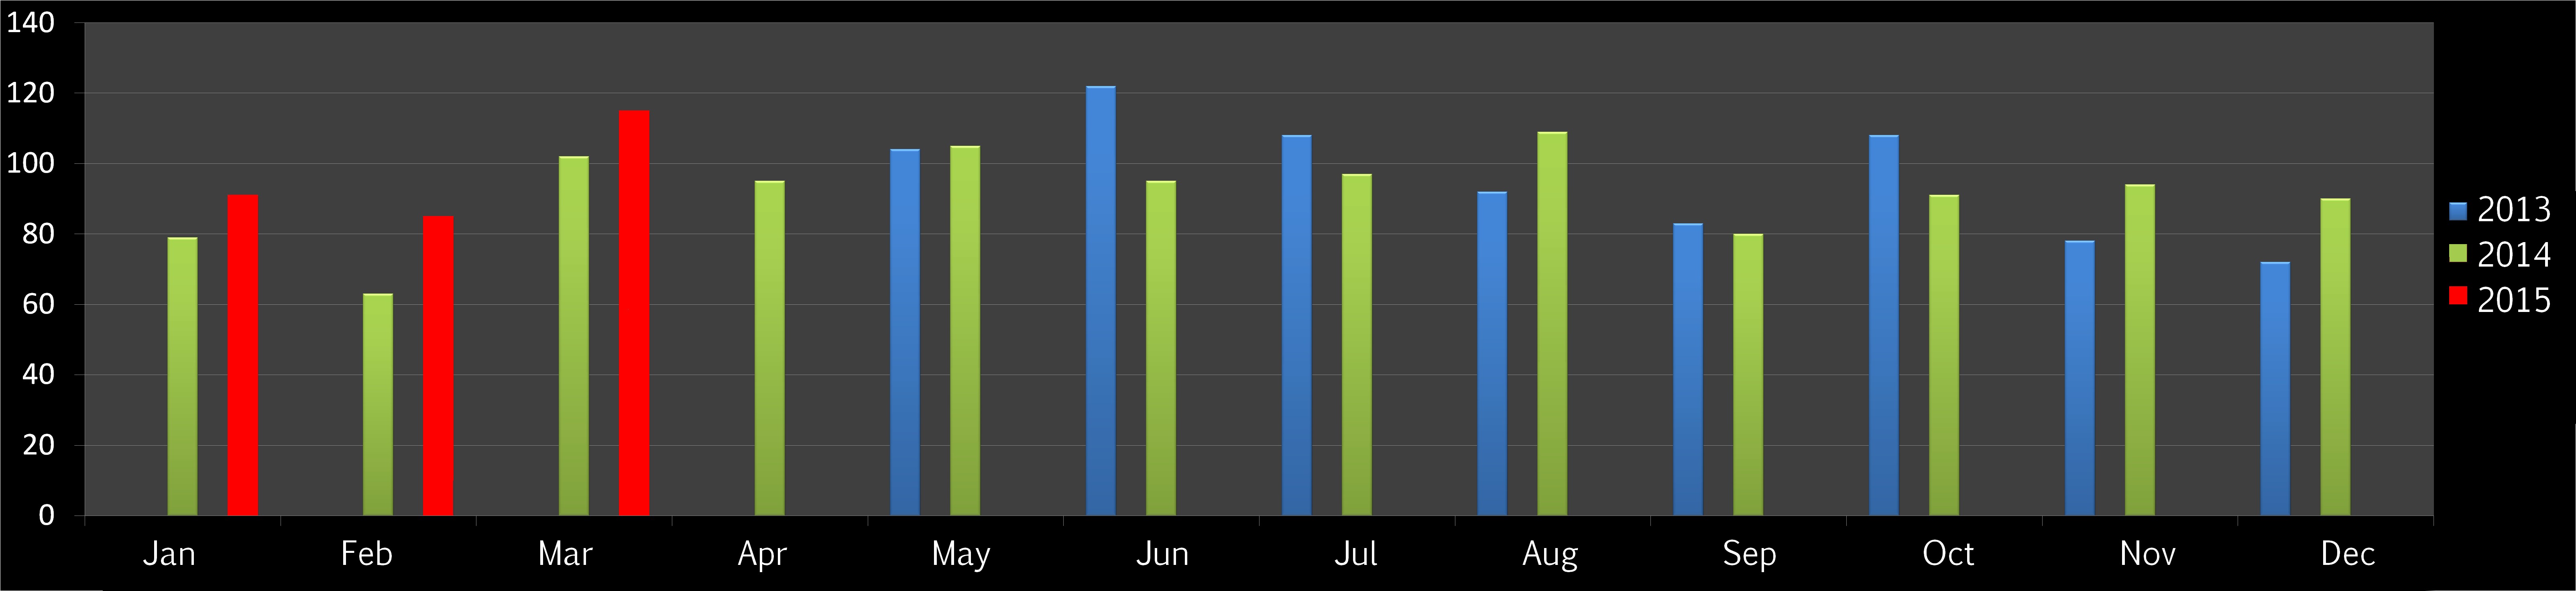
The average variance between months of different years is 14 deaths.
July 2013/2014 had the largest variance at 27 deaths.
May 2013/2014 had the lowest variance at 1 death.
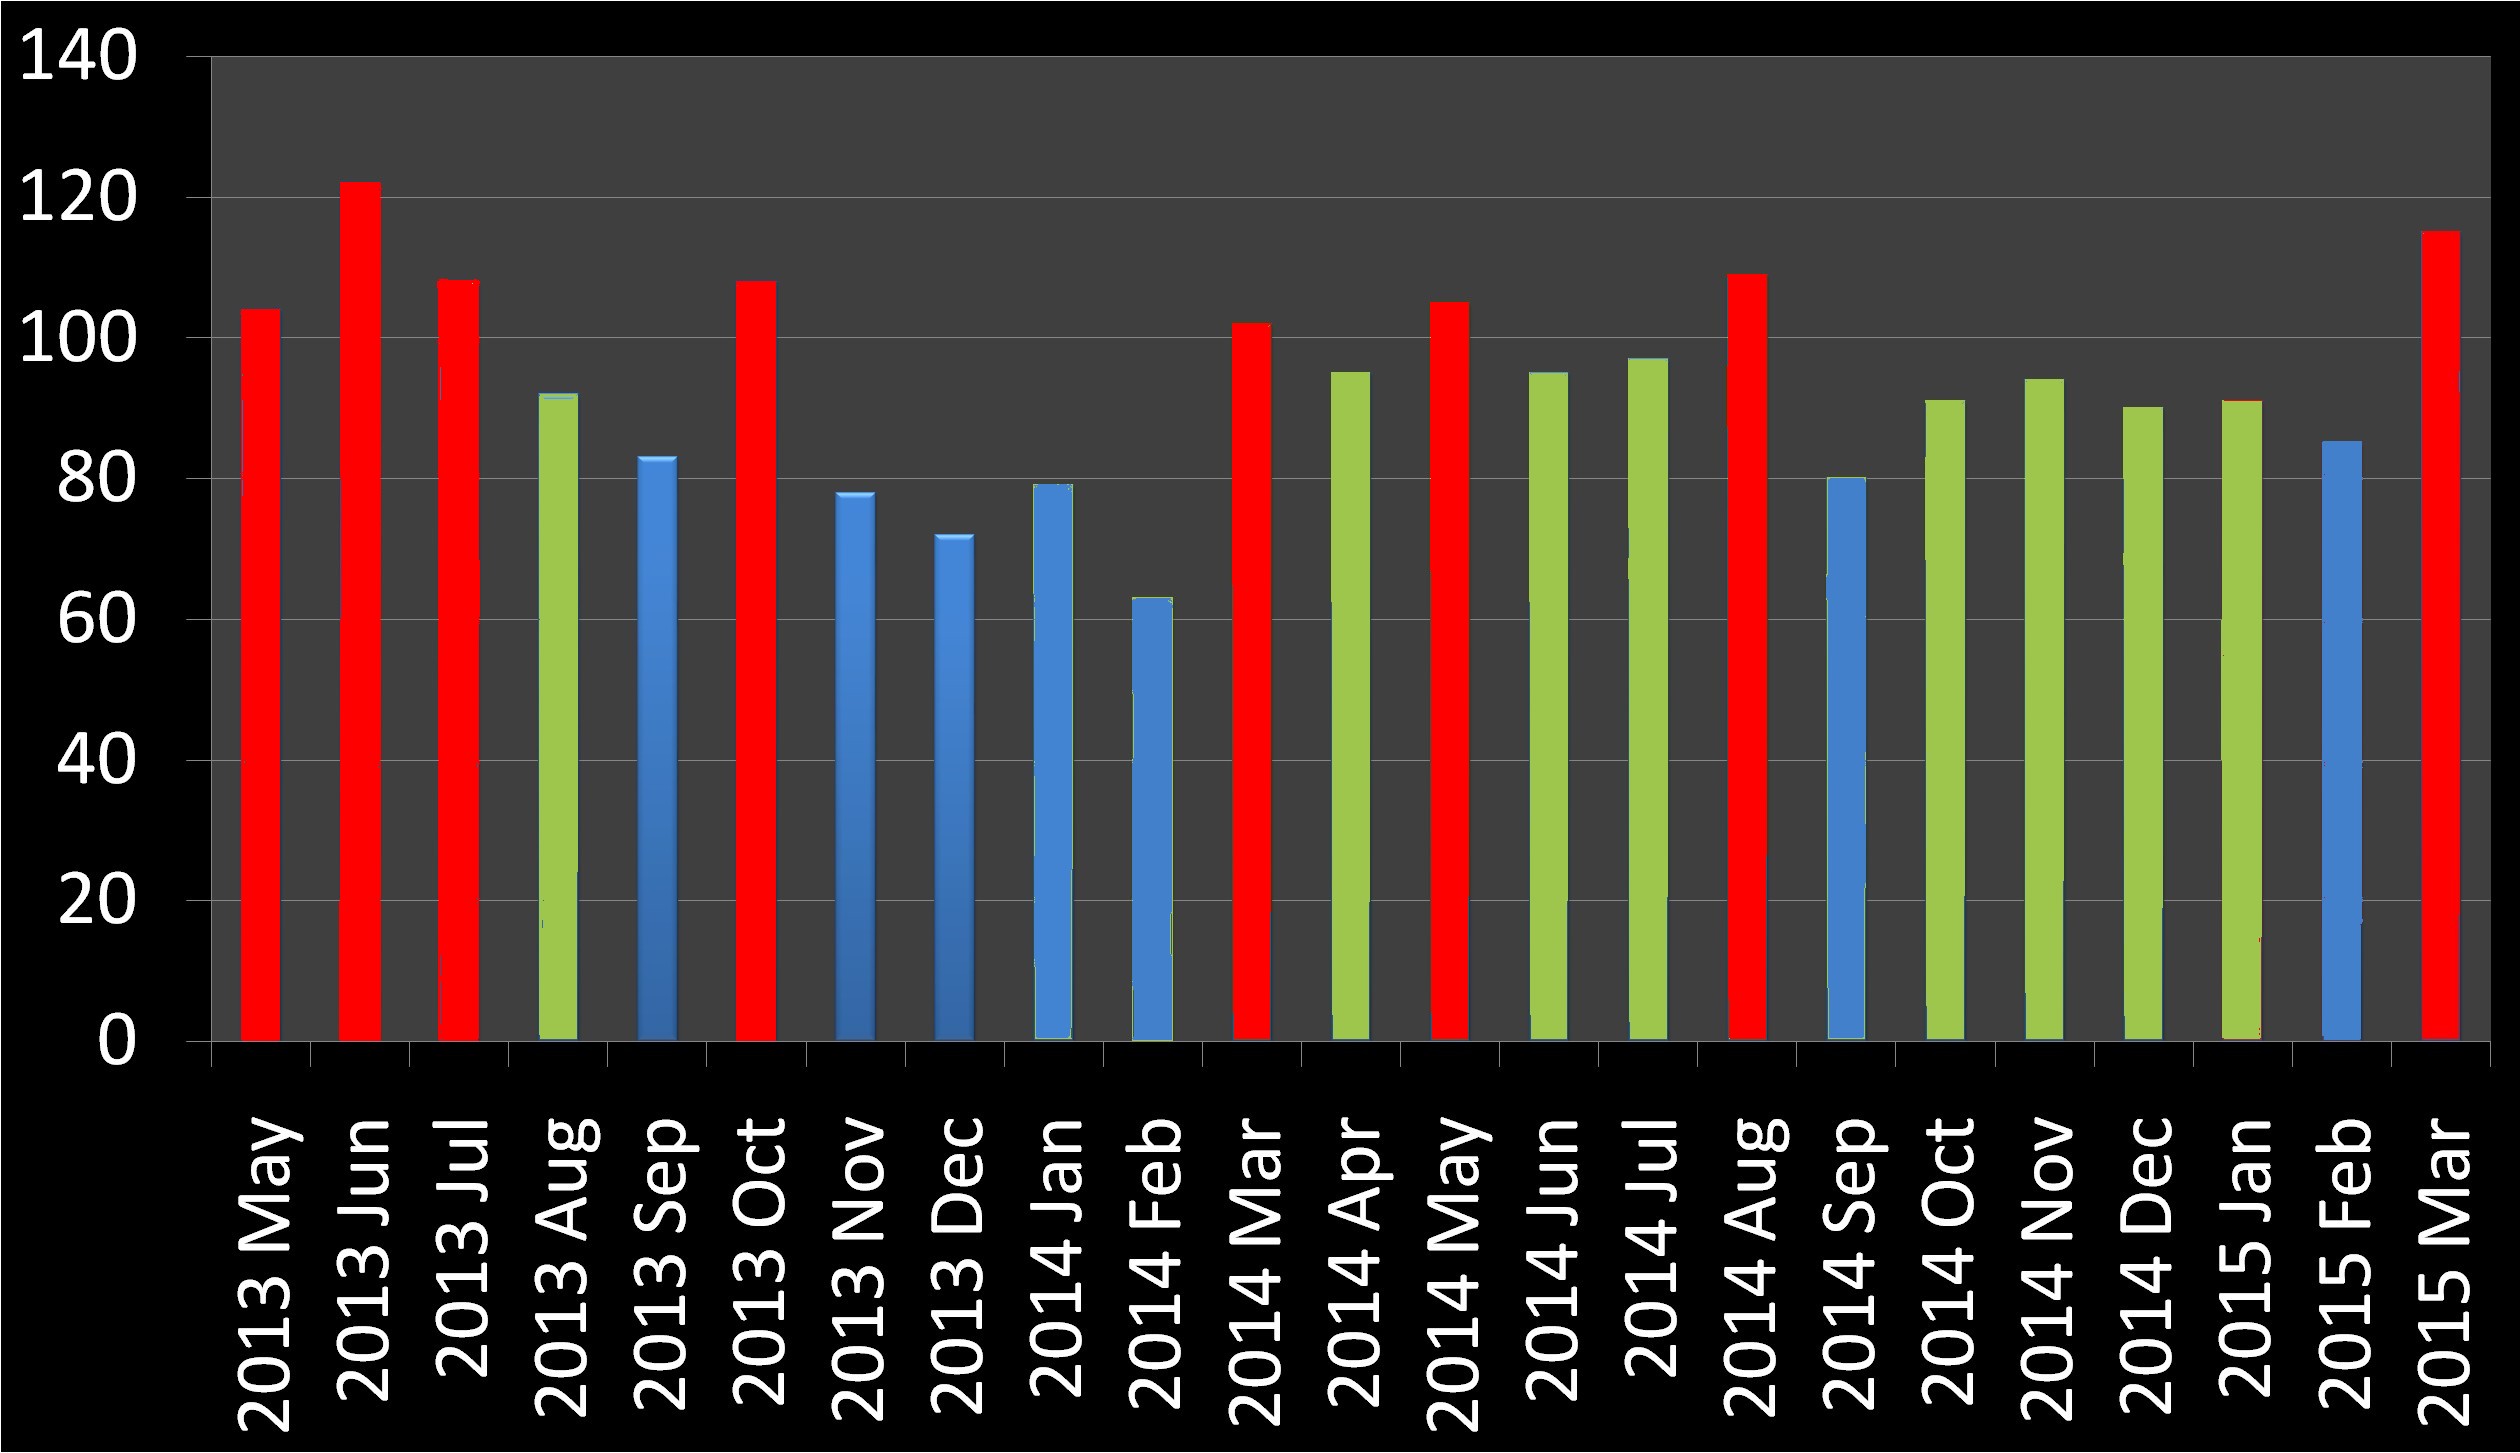
Of the 23 months listed:
8 months saw over 100 deaths a month,
8 months saw 90-100 deaths a month, and
7 months saw under 90 deaths a month.
2013 (8mo: May-December): 767 police-related deaths averaging 96 per month.
2014 (12mo: January-December): 1100 police-related deaths averaging 92 per month.
2015 (3mo: January-March): 291 police-related deaths averaging 97 per month.
The number of Americans killed by police each month averages 94 people per month.