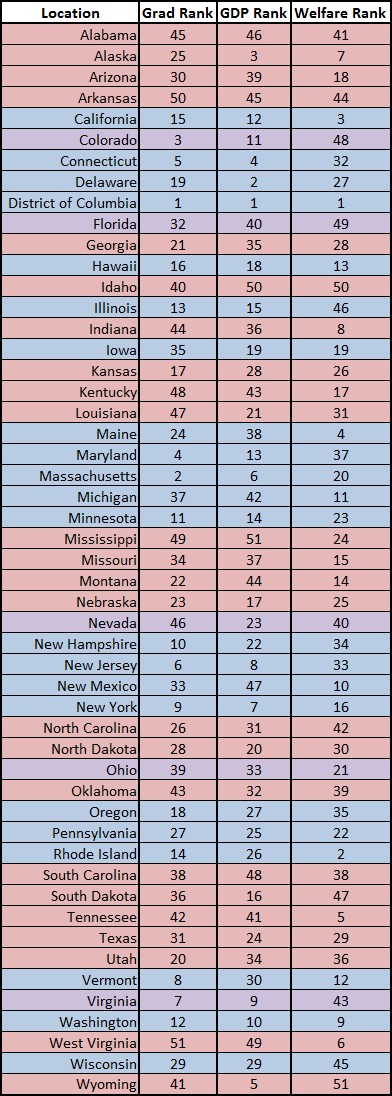
Voting Records
(from Presidential Elections)
Red – Voted mostly Republican since 1999
Purple – Even split since 1999
Blue – Voted mostly Democrat since 1999
Graduation Rank (lower number is better)
1 being the most undergrads living in the location
51 being the fewest undergrads living in the location
GDP Rank (lower number is better)
1 being the highest GDP per capita
51 being the lowest GDP per capita
Welfare Rank (higher number is better)
1 being the largest percentage of the population on Welfare
51 being the lowest percentage of the population on Welfare
Share this:
- Click to email this to a friend (Opens in new window)
- Click to share on Facebook (Opens in new window)
- Click to share on Google+ (Opens in new window)
- Click to share on Pinterest (Opens in new window)
- Click to share on Reddit (Opens in new window)
- Click to share on Tumblr (Opens in new window)
- Click to share on Twitter (Opens in new window)

Pingback: Statistical Correlations of GDP Per Capita Welfare and Voting by State